Dashboards and reporting
Achieve real-time visibility into business performance. Allow your leaders to quickly identify areas where improvements are needed and make data-driven decisions to elevate the business.

Sage Intacct dashboards and reporting core features
Slash your close time in half and accelerate finance team productivity by 40% or more.
Financial dashboards and reporting software that turns data into insight
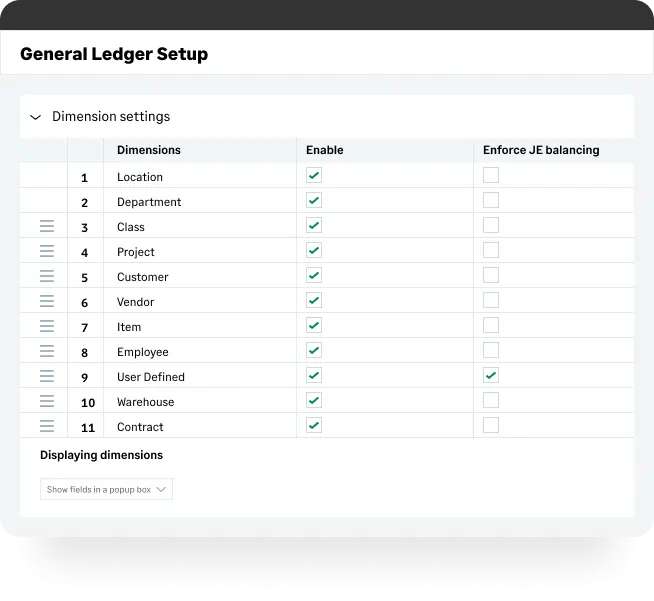
Sage Intacct’s innovative general ledger includes 8 dimensions to capture the business context of your transactions, operational measures, and budgets. That means you can quickly access or create reports that analyse real-time business performance by business drivers – without managing a complex chart of accounts.
Our 8 predefined dimensions are ready to go out of the box, including department, item, and employee. And it’s easy to add more dimensions to reflect unique business drivers and take your financial reports to the next level.

Improve business agility while saving hundreds of hours
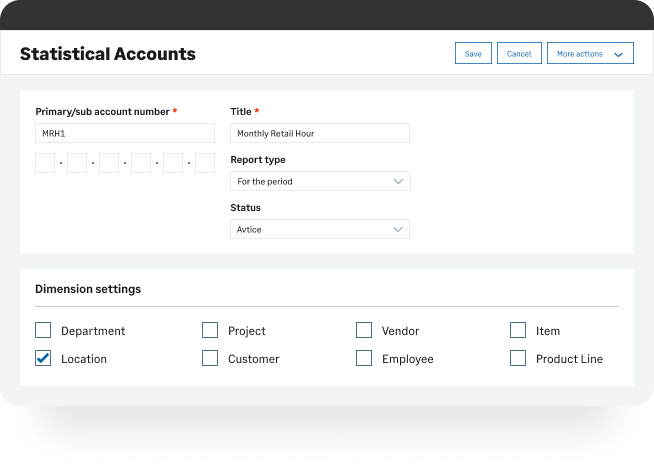
Most financial management systems can only handle financial data, but Sage Intacct tracks and reports both financial and operational data—like square footage, available hospital beds, SaaS metrics, or other granular measures that matter to your business.
With all your financial and operational data in one place, Sage Intacct’s best-in-class multi-dimensional visibility enables you to slash time spent checking the accuracy of your financial data so you can start making strategic decisions that will impact your business.
In addition to greater visibility, Sage Intacct Collaborate brings the whole team together by adding an additional secure social layer embedded in your Sage Intacct financial management platform. Collaborate spans every process and device so your finance, sales, and services teams can cooperatively resolve any issue.
Our 8 predefined dimensions are ready to go out of the box, including department, item, and employee. And it’s easy to add more dimensions to reflect unique business drivers and take your financial reports to the next level.

Get rich financial reports, your way
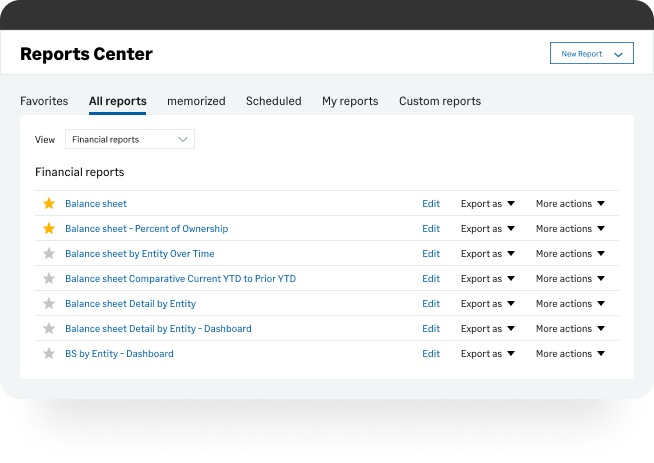
With Sage Intacct, financial reporting and analysis options are almost limitless. Compare operational statistics with financial metrics. Check summary roll-up figures for multiple entities—even if it’s only mid-month. Drill down to source transactions for granular transparency instantly. Flag trends and spot exceptions with powerful report visualisations.
With Sage Intacct dashboards and reporting, you can compare performance across any business driver that matters to you. You get 150 built-in financial reports as well as the ability to easily create custom reports. Forget Excel reporting, waiting for customised projects, or relying on external tools.

Dive deeper and go further with financial dashboards and reporting
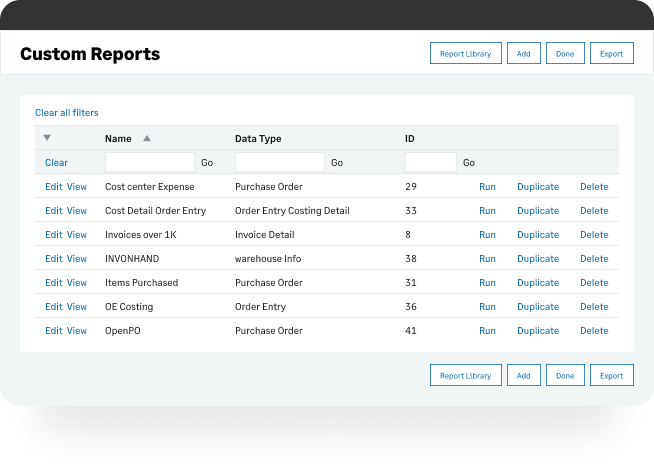
Sage Intacct’s interactive custom report writer lets you easily create real-time reports that tackle your toughest reporting needs. Get the insights you need in seconds to address complex issues and respond to market changes.
Start with hierarchical field selection, drag-and-drop design, and automatic conditional formatting, grouping, and subtotals. Then go to the next level with calculated columns with calendar and math functions, conditional logic, rolling sums and aggregations, and pivot tables. And when you need specifics, just drill down to transaction details.


Why growing businesses chose Sage Intacct
For organizations with multiple locations or entities, things like decentralized payables, intercompany billing, different tax regulations and multiple currencies create increased complexities. Those companies may want to see combined data from different entities quickly or only view metrics within a single entity.
Grab a free coffee on us, join our Coffee Break and have a demo of Sage Intacct
Join us for a 20 minute interactive demo and live Q&A.
Get the Ultimate Toolset your whole finance team will actually use!
Schedule a 30-minute call to see how we can help your with your cloud accounting strategy.
